The Main Dashboard
When you log in, you’ll land on the main dashboard. This is your command center for everything Granite.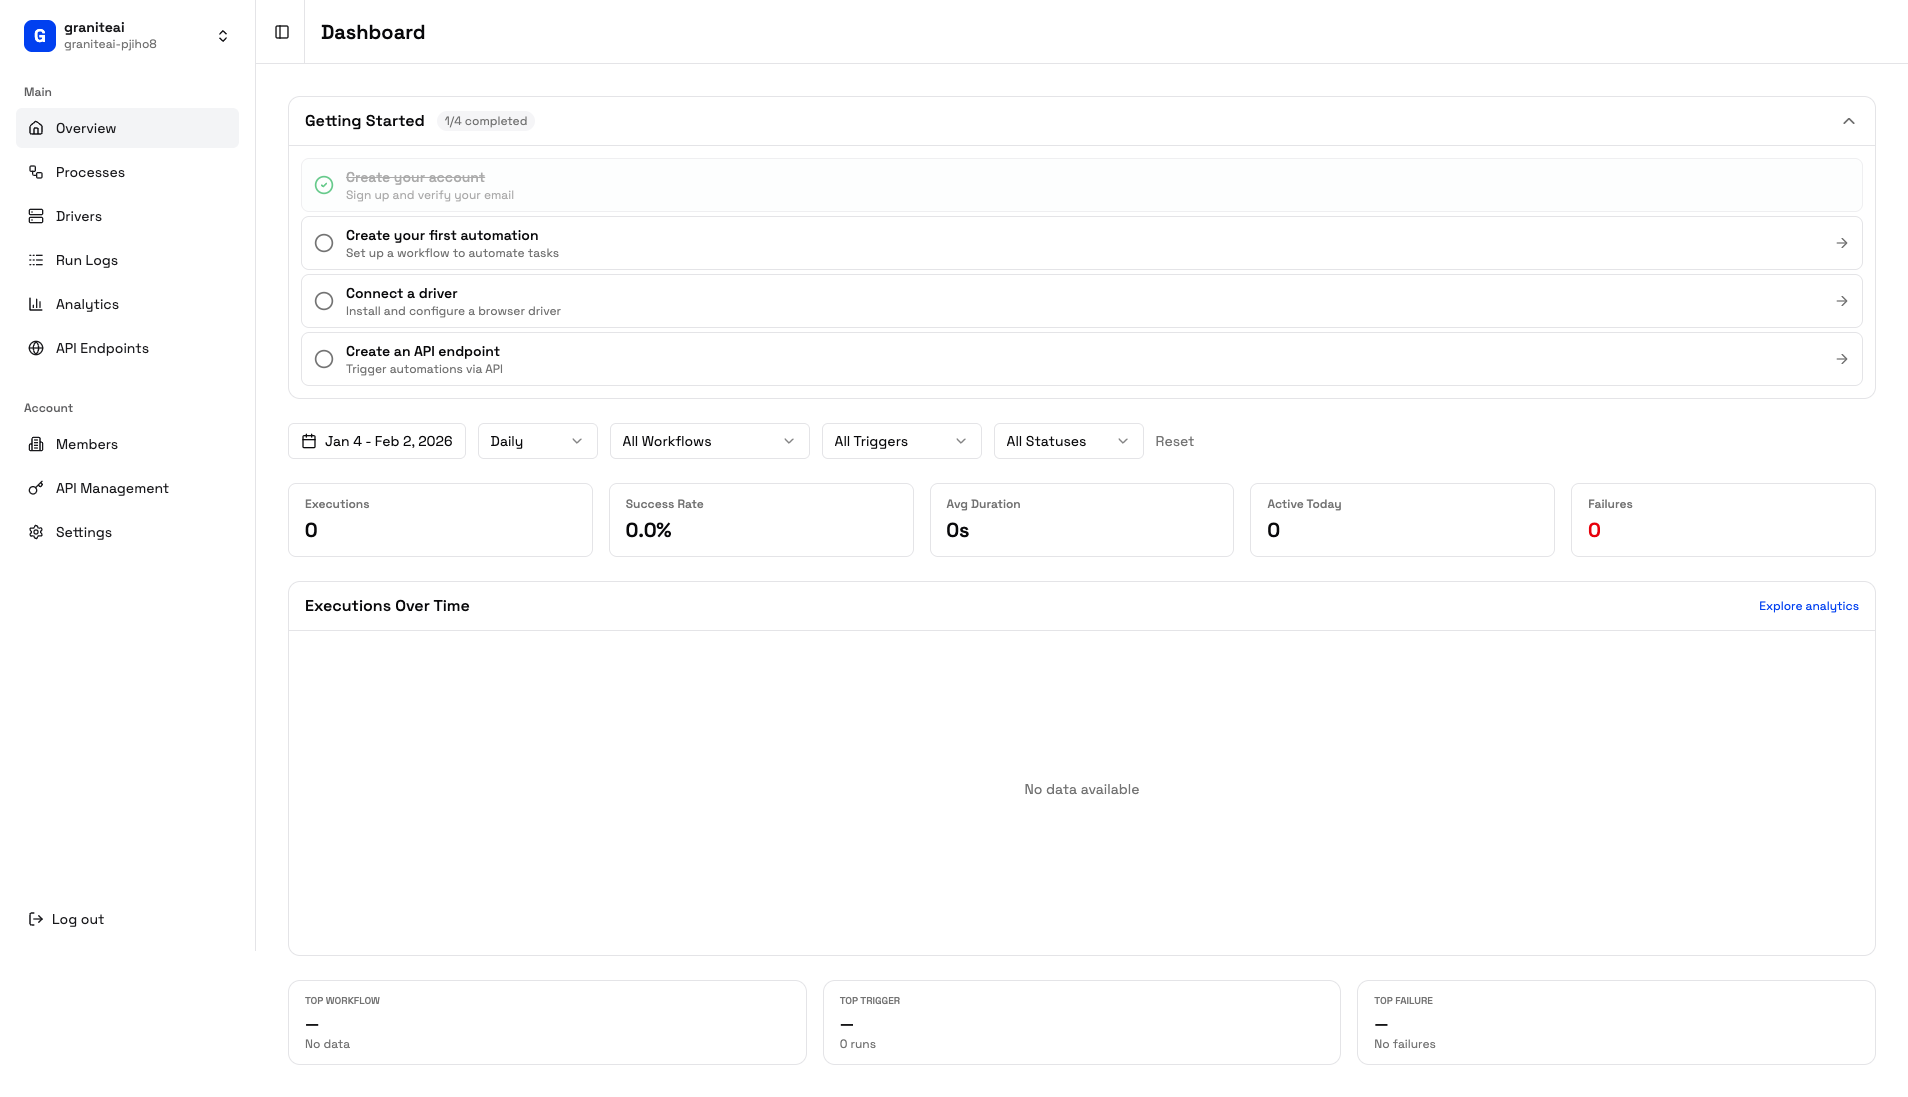
Dashboard Layout
Sidebar
Navigation to all major sections
Header
Organization switcher and user menu
Main Content
Current page content
Stats Cards
Quick metrics at a glance
Navigation Sidebar
The sidebar gives you access to everything:Getting Started Checklist
New organizations see an onboarding checklist:1
Create Your First Process
Define what you want to automate
2
Connect a Driver
Set up a Windows machine to run automations
3
Run Your First Automation
Execute a process and see it work
4
Invite Team Members
Add colleagues to your organization
Stats Overview
The dashboard shows key metrics:Total Executions
All-time automation runs
Success Rate
Percentage of successful runs
Active Today
Runs in the last 24 hours
Avg Duration
Average execution time
Recent Activity
Below the stats, you’ll see:- Recent executions - Last few automation runs
- Status indicators - Success, failed, or running
- Quick actions - View details, re-run, etc.
Organization Switcher
In the top-left corner, click your organization name to:- Switch to another organization
- Create a new organization
- See your current role
User Menu
Click your avatar in the top-right for:- Account settings
- Logout
Keyboard Shortcuts
Quick Actions
From the dashboard, you can quickly:- Create Process - Click the + button
- View Logs - Click any execution to see details
- Check Drivers - See which machines are online
Next Steps
Create a Process
Start automating
View Analytics
Dive into your metrics