

Analytics Dashboard
The Analytics page gives you deep insights into your automation performance.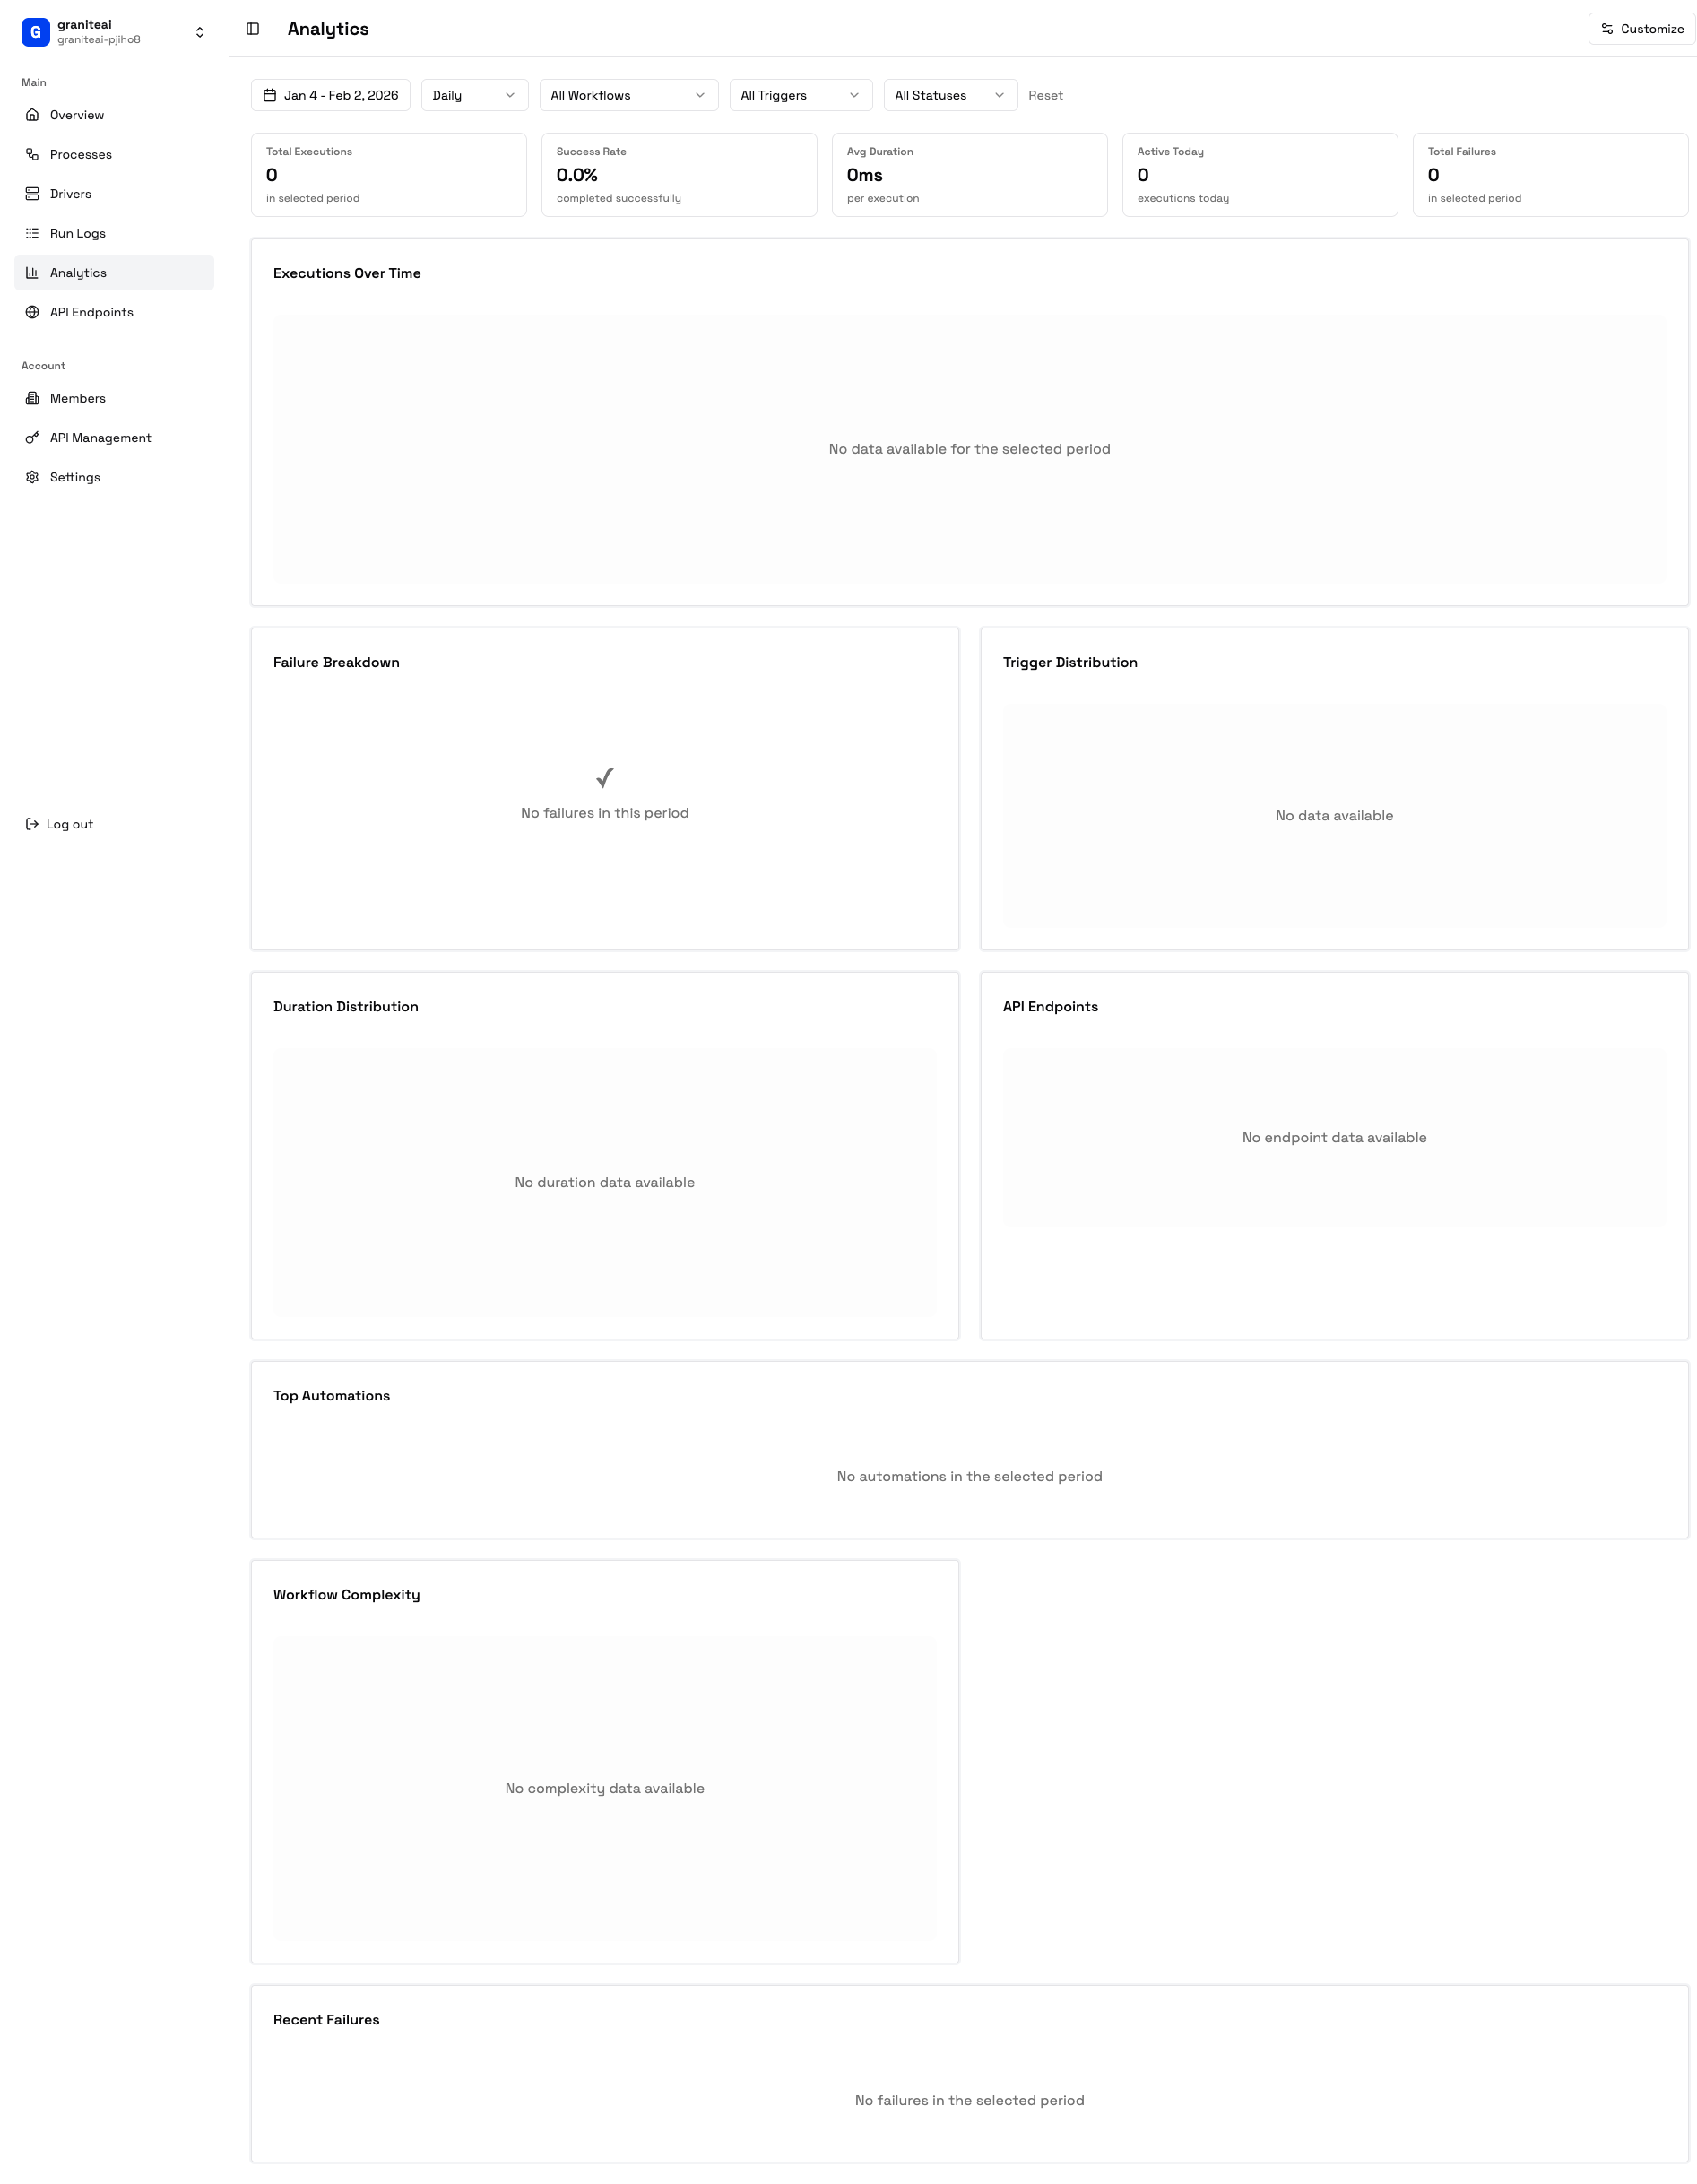
Dashboard Overview
Your analytics dashboard shows:- Summary stats - Key metrics at a glance
- Charts - Visual trends over time
- Tables - Detailed breakdowns
- Filters - Narrow down by date, process, status
Key Metrics
Total Executions
Number of automation runs
Success Rate
Percentage that completed successfully
Avg Duration
Average execution time
Active Today
Runs in the last 24 hours
Available Widgets
- Executions Over Time
- Success Rate
- Failure Breakdown
- Duration Distribution
- Top Automations
Line chart showing execution volume by day/week/month.Use it to:
- Spot usage trends
- Identify peak periods
- Track adoption over time
More Widgets
Filters
Narrow your analytics view:Customizing the Dashboard
Arrange widgets to your preference:1
Enter Edit Mode
Click Customize in the top right
2
Drag and Drop
Move widgets to rearrange them
3
Add/Remove Widgets
Click + to add new widgets or × to remove
4
Save Layout
Click Save to keep your arrangement
Understanding the Data
Execution Metrics
Failure Categories
Interpreting Charts
Healthy Patterns
- Steady or increasing success rate - Things are working well
- Consistent execution times - Predictable performance
- Spread of trigger types - Good adoption
Warning Signs
- Declining success rate - Something’s breaking
- Increasing durations - Performance degradation
- Spike in failures - Recent change caused issues
Exporting Analytics
Export data for external analysis:- Click Export in the top right
- Choose format: CSV or JSON
- Select date range
- Download
API Access
You can also fetch analytics via API:Analytics Tips
Check analytics regularly
Check analytics regularly
Make it a habit to review analytics weekly. Catch issues before they become problems.
Set baseline expectations
Set baseline expectations
Know what “normal” looks like for your automations. Then you’ll notice when things change.
Drill into failures
Drill into failures
Don’t just note that failures increased. Click through to the actual failed runs and understand why.
Compare periods
Compare periods
Use date range filters to compare this week vs. last week, or this month vs. last month.
Next Steps
Run Logs
See individual executions
Troubleshooting
Fix common issues