> ## Documentation Index
> Fetch the complete documentation index at: https://docs.getgranite.ai/llms.txt
> Use this file to discover all available pages before exploring further.
# Run Logs
> View and analyze your execution history
## Execution History
The Run Logs page shows all past automation executions across your organization.
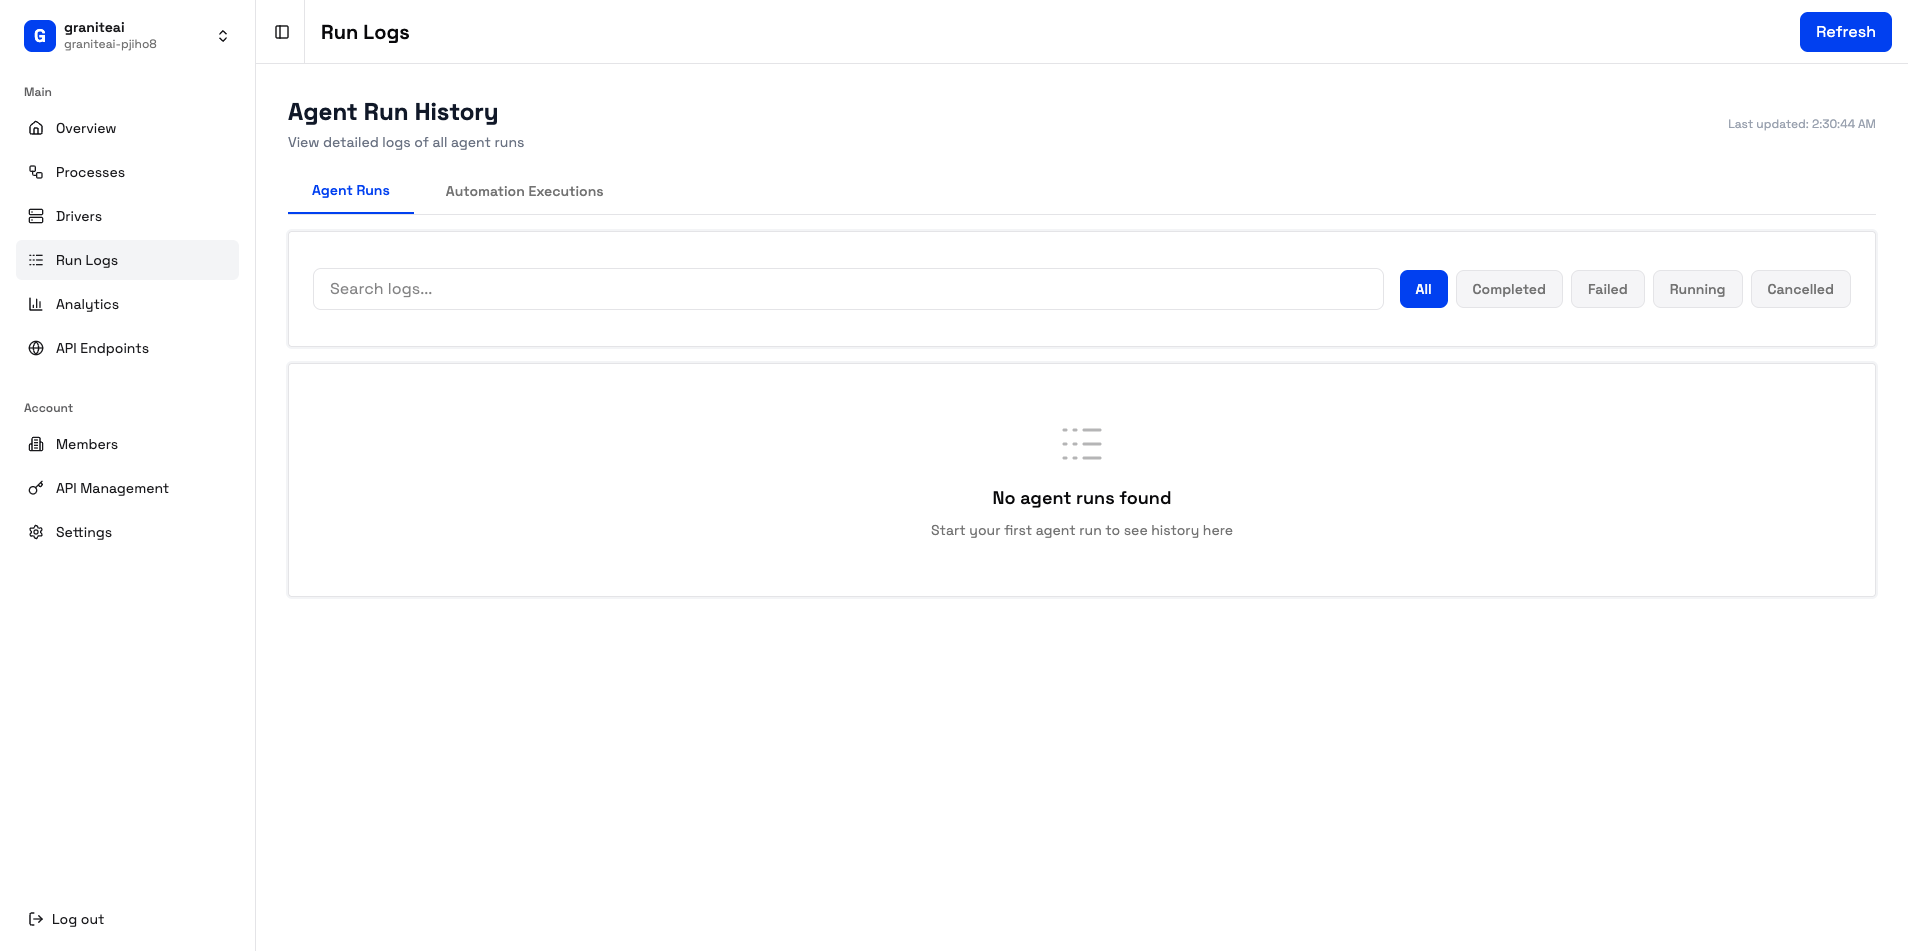 ## Filtering Logs
Narrow down your view with filters:
| Filter | Options |
| -------------- | ---------------------------------------- |
| **Status** | Success, Failed, Cancelled, Running |
| **Process** | Select specific process |
| **Date Range** | Today, last 7 days, last 30 days, custom |
| **Driver** | Filter by machine |
## Log List View
Each log entry shows:
* **Process name** - Which automation ran
* **Status badge** - Success/Failed/Cancelled
* **Duration** - How long it took
* **Timestamp** - When it ran
* **Driver** - Which machine executed it
## Viewing Run Details
Click any log entry to see full details:
* Execution status
* Total duration
* Number of actions
* Trigger type (manual, API, scheduled)
Step-by-step trace of the execution:
```
10:15:32 - Started execution
10:15:35 - Connected to driver-01
10:15:38 - Action: Open Excel
10:15:42 - Action: Click File menu
10:15:45 - Action: Select Open
...
10:18:22 - Completed successfully
```
Browse captured screenshots:
* Before/after each action
* Error states
* Final result
Watch the full video recording:
* Play in browser
* Download as MP4
## Status Types
| Status | Meaning | Color |
| ------------- | ------------------------ | ------ |
| **Success** | Completed without errors | Green |
| **Failed** | Encountered an error | Red |
| **Cancelled** | Stopped by user | Yellow |
| **Running** | Currently executing | Blue |
## Searching Logs
Use the search bar to find logs by:
* Process name
* Error messages
* Action descriptions
Search for specific error messages like "element not found" to identify patterns in failures.
## Bulk Actions
Select multiple logs to:
* **Delete** - Remove selected logs
* **Export** - Download as CSV/JSON
## Re-running Failed Executions
From a failed execution's detail page:
1. Review what went wrong
2. Click **Retry** to run again
3. Or **Edit Process** to fix the issue first
## Log Retention
Logs are retained based on your plan:
| Plan | Retention |
| ---------- | --------- |
| Free | 7 days |
| Pro | 30 days |
| Enterprise | Custom |
Screenshots and recordings may have different retention periods. Check your organization settings.
## Exporting Logs
Export execution data for external analysis:
1. Select the logs you want (or all)
2. Click **Export**
3. Choose format: CSV or JSON
4. Download the file
### CSV Format
```csv theme={null}
id,process_name,status,duration_ms,started_at,finished_at,driver_id
run_123,Sales Report,success,180000,2024-01-15T10:15:32Z,2024-01-15T10:18:32Z,driver-01
```
### JSON Format
```json theme={null}
{
"id": "run_123",
"process_name": "Sales Report",
"status": "success",
"duration_ms": 180000,
"started_at": "2024-01-15T10:15:32Z",
"finished_at": "2024-01-15T10:18:32Z",
"driver_id": "driver-01",
"actions": [...]
}
```
## Debugging Failed Runs
When an execution fails:
The timeline shows where the failure occurred and why
See the state of the desktop when the error happened
Sometimes seeing the full context reveals the issue
Was the driver machine having issues? Check Driver Management
### Common Failure Patterns
The agent couldn't locate a UI element. Possible causes:
* Application didn't open in time
* UI changed since last run
* Element is behind a popup
The action took too long. Possible causes:
* Slow network
* Application not responding
* Machine overloaded
Lost contact with the driver. Possible causes:
* Network issue
* Driver crashed
* Machine rebooted
## Next Steps
See trends and patterns
Debug common issues
## Filtering Logs
Narrow down your view with filters:
| Filter | Options |
| -------------- | ---------------------------------------- |
| **Status** | Success, Failed, Cancelled, Running |
| **Process** | Select specific process |
| **Date Range** | Today, last 7 days, last 30 days, custom |
| **Driver** | Filter by machine |
## Log List View
Each log entry shows:
* **Process name** - Which automation ran
* **Status badge** - Success/Failed/Cancelled
* **Duration** - How long it took
* **Timestamp** - When it ran
* **Driver** - Which machine executed it
## Viewing Run Details
Click any log entry to see full details:
* Execution status
* Total duration
* Number of actions
* Trigger type (manual, API, scheduled)
Step-by-step trace of the execution:
```
10:15:32 - Started execution
10:15:35 - Connected to driver-01
10:15:38 - Action: Open Excel
10:15:42 - Action: Click File menu
10:15:45 - Action: Select Open
...
10:18:22 - Completed successfully
```
Browse captured screenshots:
* Before/after each action
* Error states
* Final result
Watch the full video recording:
* Play in browser
* Download as MP4
## Status Types
| Status | Meaning | Color |
| ------------- | ------------------------ | ------ |
| **Success** | Completed without errors | Green |
| **Failed** | Encountered an error | Red |
| **Cancelled** | Stopped by user | Yellow |
| **Running** | Currently executing | Blue |
## Searching Logs
Use the search bar to find logs by:
* Process name
* Error messages
* Action descriptions
Search for specific error messages like "element not found" to identify patterns in failures.
## Bulk Actions
Select multiple logs to:
* **Delete** - Remove selected logs
* **Export** - Download as CSV/JSON
## Re-running Failed Executions
From a failed execution's detail page:
1. Review what went wrong
2. Click **Retry** to run again
3. Or **Edit Process** to fix the issue first
## Log Retention
Logs are retained based on your plan:
| Plan | Retention |
| ---------- | --------- |
| Free | 7 days |
| Pro | 30 days |
| Enterprise | Custom |
Screenshots and recordings may have different retention periods. Check your organization settings.
## Exporting Logs
Export execution data for external analysis:
1. Select the logs you want (or all)
2. Click **Export**
3. Choose format: CSV or JSON
4. Download the file
### CSV Format
```csv theme={null}
id,process_name,status,duration_ms,started_at,finished_at,driver_id
run_123,Sales Report,success,180000,2024-01-15T10:15:32Z,2024-01-15T10:18:32Z,driver-01
```
### JSON Format
```json theme={null}
{
"id": "run_123",
"process_name": "Sales Report",
"status": "success",
"duration_ms": 180000,
"started_at": "2024-01-15T10:15:32Z",
"finished_at": "2024-01-15T10:18:32Z",
"driver_id": "driver-01",
"actions": [...]
}
```
## Debugging Failed Runs
When an execution fails:
The timeline shows where the failure occurred and why
See the state of the desktop when the error happened
Sometimes seeing the full context reveals the issue
Was the driver machine having issues? Check Driver Management
### Common Failure Patterns
The agent couldn't locate a UI element. Possible causes:
* Application didn't open in time
* UI changed since last run
* Element is behind a popup
The action took too long. Possible causes:
* Slow network
* Application not responding
* Machine overloaded
Lost contact with the driver. Possible causes:
* Network issue
* Driver crashed
* Machine rebooted
## Next Steps
See trends and patterns
Debug common issues