> ## Documentation Index
> Fetch the complete documentation index at: https://docs.getgranite.ai/llms.txt
> Use this file to discover all available pages before exploring further.
# Dashboard Overview
> Navigate the Granite dashboard interface
## The Main Dashboard
When you log in, you'll land on the main dashboard. This is your command center for everything Granite.
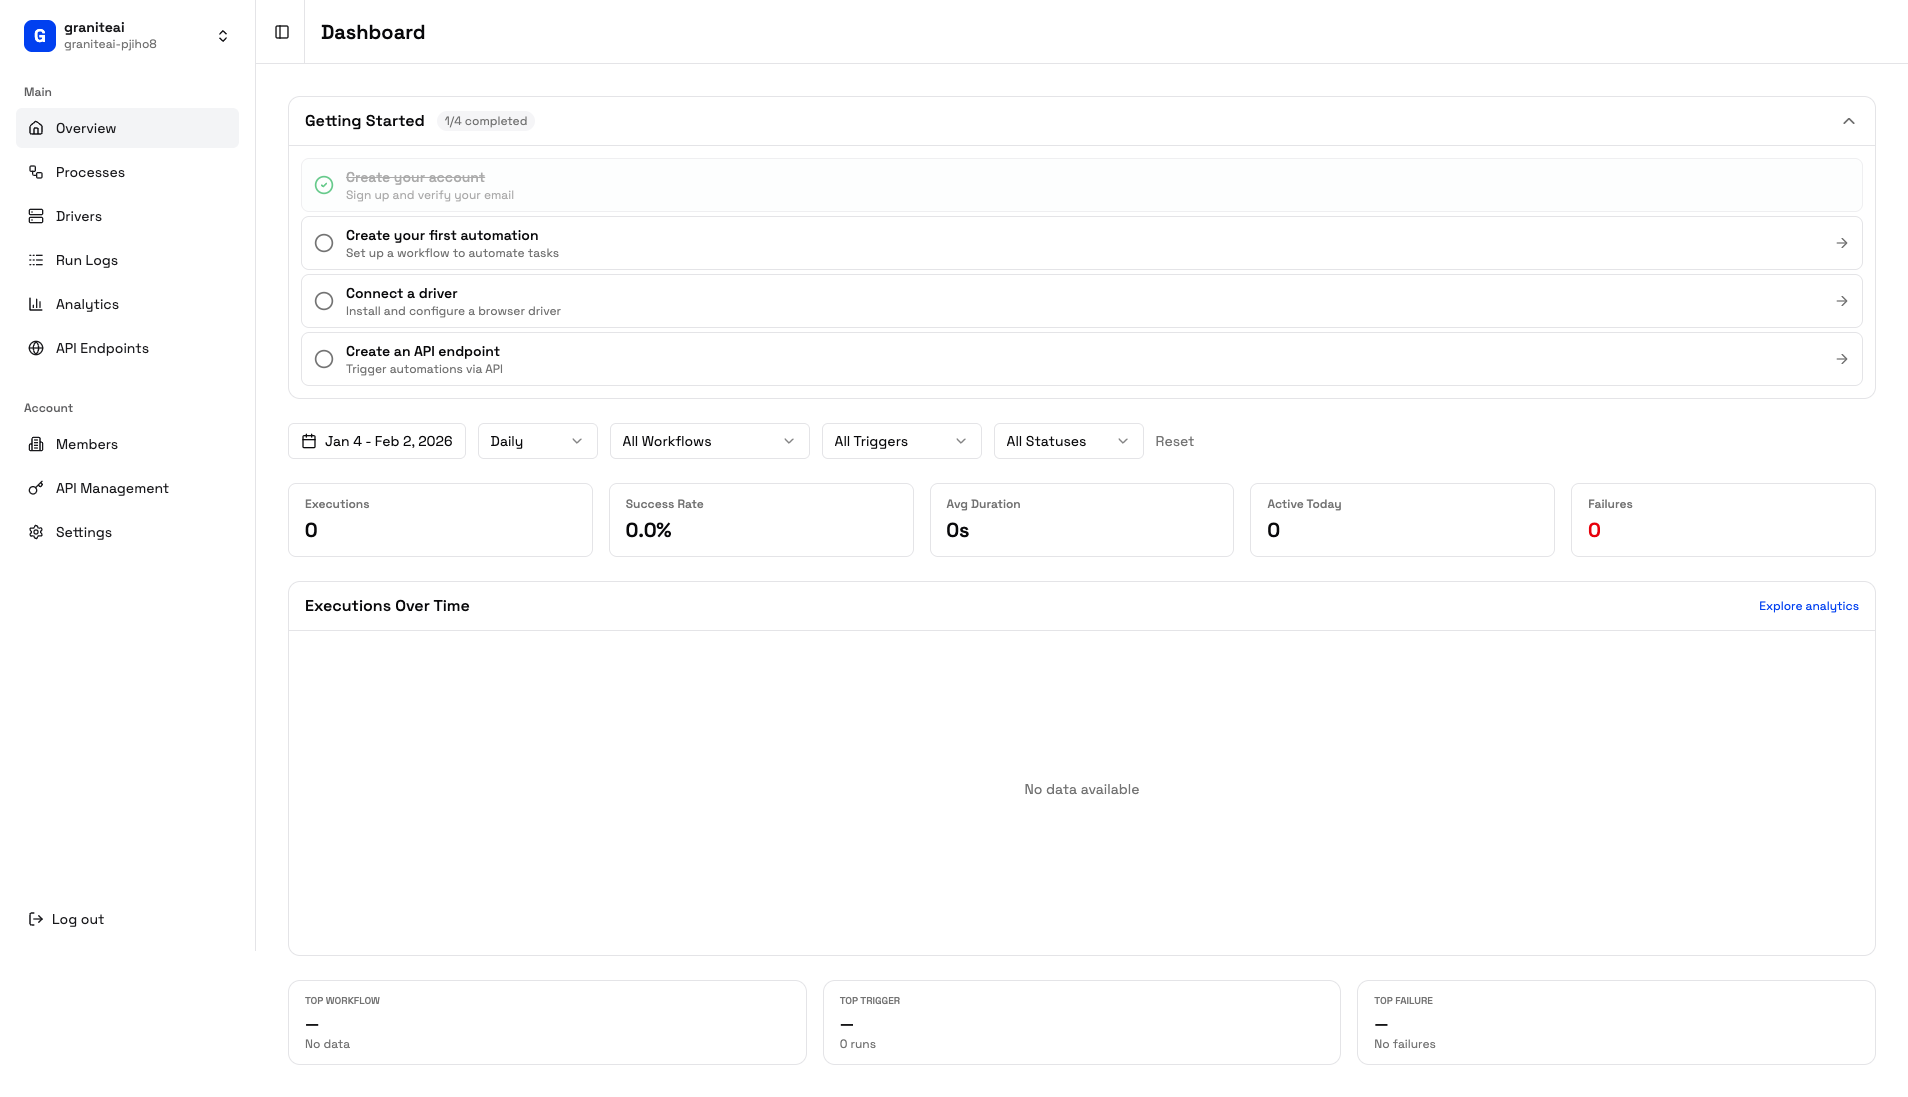 ## Dashboard Layout
Navigation to all major sections
Organization switcher and user menu
Current page content
Quick metrics at a glance
## Navigation Sidebar
The sidebar gives you access to everything:
| Section | What It Does |
| ------------------ | --------------------------------------- |
| **Dashboard** | Overview with stats and recent activity |
| **Processes** | Create and manage automation processes |
| **Run Logs** | View execution history |
| **Analytics** | Detailed metrics and charts |
| **API Endpoints** | Configure public API triggers |
| **API Management** | Manage API keys and tokens |
| **Drivers** | Monitor connected machines |
| **Members** | Team management |
| **Settings** | Organization configuration |
## Getting Started Checklist
New organizations see an onboarding checklist:
Define what you want to automate
Set up a Windows machine to run automations
Execute a process and see it work
Add colleagues to your organization
You can dismiss the checklist once you're familiar with the platform. It won't come back.
## Stats Overview
The dashboard shows key metrics:
All-time automation runs
Percentage of successful runs
Runs in the last 24 hours
Average execution time
## Recent Activity
Below the stats, you'll see:
* **Recent executions** - Last few automation runs
* **Status indicators** - Success, failed, or running
* **Quick actions** - View details, re-run, etc.
## Organization Switcher
In the top-left corner, click your organization name to:
* Switch to another organization
* Create a new organization
* See your current role
## User Menu
Click your avatar in the top-right for:
* Account settings
* Logout
## Keyboard Shortcuts
| Shortcut | Action |
| -------------------- | ----------------------- |
| `⌘ + K` / `Ctrl + K` | Open command palette |
| `⌘ + /` / `Ctrl + /` | Show keyboard shortcuts |
## Quick Actions
From the dashboard, you can quickly:
* **Create Process** - Click the + button
* **View Logs** - Click any execution to see details
* **Check Drivers** - See which machines are online
## Next Steps
Start automating
Dive into your metrics
## Dashboard Layout
Navigation to all major sections
Organization switcher and user menu
Current page content
Quick metrics at a glance
## Navigation Sidebar
The sidebar gives you access to everything:
| Section | What It Does |
| ------------------ | --------------------------------------- |
| **Dashboard** | Overview with stats and recent activity |
| **Processes** | Create and manage automation processes |
| **Run Logs** | View execution history |
| **Analytics** | Detailed metrics and charts |
| **API Endpoints** | Configure public API triggers |
| **API Management** | Manage API keys and tokens |
| **Drivers** | Monitor connected machines |
| **Members** | Team management |
| **Settings** | Organization configuration |
## Getting Started Checklist
New organizations see an onboarding checklist:
Define what you want to automate
Set up a Windows machine to run automations
Execute a process and see it work
Add colleagues to your organization
You can dismiss the checklist once you're familiar with the platform. It won't come back.
## Stats Overview
The dashboard shows key metrics:
All-time automation runs
Percentage of successful runs
Runs in the last 24 hours
Average execution time
## Recent Activity
Below the stats, you'll see:
* **Recent executions** - Last few automation runs
* **Status indicators** - Success, failed, or running
* **Quick actions** - View details, re-run, etc.
## Organization Switcher
In the top-left corner, click your organization name to:
* Switch to another organization
* Create a new organization
* See your current role
## User Menu
Click your avatar in the top-right for:
* Account settings
* Logout
## Keyboard Shortcuts
| Shortcut | Action |
| -------------------- | ----------------------- |
| `⌘ + K` / `Ctrl + K` | Open command palette |
| `⌘ + /` / `Ctrl + /` | Show keyboard shortcuts |
## Quick Actions
From the dashboard, you can quickly:
* **Create Process** - Click the + button
* **View Logs** - Click any execution to see details
* **Check Drivers** - See which machines are online
## Next Steps
Start automating
Dive into your metrics